Growth reporting across a $10.12M Amazon sales period
I connected advertising, creators and external traffic into one decision framework, covering $10.12M in marketplace sales and $1.29M in tracked channel spend.
- Client
- Amazon bedding company / US marketplace
- Period
- 1 October 2025 - 14 February 2026
- Contribution
- Marketing analytics and cross-functional reporting

Delivered result
A shared channel-review framework covering $10,124,582.24 in Seller Central sales, $1,291,589.33 in tracked spend and a reported 4.75x attributed ROAS for 1 October 2025 - 14 February 2026. Teams could compare performance without confusing channel attribution with company revenue.
The result
I structured a common way to review marketplace performance across paid advertising, creators and external acquisition. The result was a clearer management discussion: which channel changed, what investment supported it, and whether the movement came from traffic, conversion or availability.
The reporting covered $10.12M in Seller Central sales during the reviewed period. That scale made consistent definitions essential: channel-attributed sales and company sales needed to remain separate, while still informing the same decisions.
The challenge
Which channels deserve attention, and which metrics actually describe the business? Sponsored ads, DSP, creators and off-Amazon traffic all contributed to the same marketplace, but their reporting conventions were not interchangeable.
This study covers the measurement workstream within a wider bedding-company engagement. The seasonal review, creator measurement and product-operations studies describe related parts of that same business, not separate clients.
Scope and contribution
My work sat at the intersection of marketing analysis, reporting and cross-functional coordination. The useful output was a shared way to discuss traffic, conversion, revenue and investment without treating every platform's attributed sales as a separate sale.
The archived reporting layer includes a channel comparison, weekly sales and spend exports, efficiency metrics and written guidance explaining how each report should be interpreted. Channel owners and analysts remained responsible for their respective execution and data sources.
Historical reporting snapshot
The figures below use the same date filter: 1 October 2025 through 14 February 2026, in USD.
| Reported measure | Value | Interpretation |
|---|---|---|
| Seller Central sales | $10,124,582.24 | Marketplace business total in the export |
| Channel-attributed sales | $6,132,320.63 | Combined reported attribution; overlaps are possible |
| Tracked channel spend | $1,291,589.33 | Spend included in this reporting view |
| Reported aggregate ROAS | 4.75x | Attributed sales divided by tracked spend |
The 4.75x reported ROAS expresses channel-attributed sales relative to tracked spend for the reviewed period.
How the analysis was structured
- Keep the marketplace business total separate from the channel-attribution total.
- Compare each channel's traffic and conversion signals in its own measurement context.
- Review weekly changes in both sales and spend instead of averaging weekly ROAS.
- Use inventory, promotions and the seasonal calendar to interpret unusual movements.
- Take questions back to channel owners before changing an allocation.
For example, clicks from an external ad platform are not the same event as a Seller Central session. A missing metric should remain missing rather than silently become zero.
Connecting reports without mixing their meanings
The additional report specifications make an important distinction: one dashboard cannot answer every growth question. The analytical handoff needs to retain the scope and timing of each source.
| Reporting layer | Useful question | Measurement basis |
|---|---|---|
| Channel attribution | Which channels report purchases and at what recorded cost? | Channel-specific attribution windows |
| Sales and returns | Is movement driven by traffic, orders, units or returns? | Money, units and orders are separate measurement modes |
| Promotion review | How much sales value remains after discounts? | Revenue after promotional discounts |
| Management P&L | Which costs explain margin pressure? | Weekly management diagnostics |
| Finalized profitability | What financial result remains after reconciliation? | Monthly accounting close |
| Market intelligence | Is the brand's relative category position changing? | Estimated Top 100 ASIN coverage |
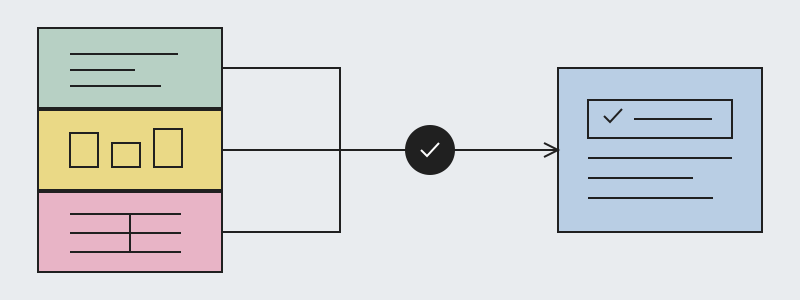
Reporting framework: attribution, sales and cost views connected to commercial decisions.
The same label can hide different definitions. In the promotion specification, net sales deducts promotional discounts. In the company-summary specification, it also deducts refunds and internal platform advertising. I therefore keep the report name and deductions attached to a metric instead of silently treating every net-sales field as interchangeable.
The financial reporting layer normalizes currencies to USD using the financial event date, keeping costs and revenue comparable across reports.
What the work made possible
I brought traffic, conversion, spend and availability into the same review process. Teams gained a consistent basis for channel comparison, clearer questions for channel owners and a disciplined way to interpret ROAS before making budget decisions.
The completed framework connected channel performance with commercial context across a $10.12M marketplace sales period, giving teams a shared basis for review and budget discussions.
Source notes
Amazon US Traffic summary, weekly sales, spend and ROAS exports for 1 October 2025 - 14 February 2026. Supporting report specifications cover company performance, promotions, returns, management P&L, finalized profitability and market intelligence. Channel-attributed sales use each platform's attribution window; Seller Central provides the marketplace sales total.
Related expertise
Marketing and sales analytics, Amazon advertising and Amazon external traffic.
Amazon US reporting for 1 October 2025 - 14 February 2026, combining Seller Central sales with channel-attributed sales, tracked spend and ROAS.